SLURRY FRICTION HEAD LOSSES IN PIPELINES
Despite the long history of successful slurry pumping operations covering a wide range of slurries, limited published data is available to estimate Hf accurately, for every possible duty. A high degree of accuracy is normally required only if Hf represents a high proportion of the Total Dynamic Head, H, for a proposed application so that large errors in estimating Hf would be reflected in correspondingly large errors in estimating H.
This normally applies to very long distance pumping duties only. For most Warman Pump applications, a high degree of accuracy in estimating Hf is not required.
µ
At sufficiently low concentrations Hf will be close to that for clear water and may be estimated by the same empirical method as applied to Category ‘A’ Heterogeneous Slurries.
At sufficiently high concentrations, the Yield Stress characteristic largely influences the value of Hf. For further information on pumping, homogeneous slurries with high concentrations, contact your nearest Warman representative.
Category ‘A’: Particles essentially all coarser than 50µm and finer than 300µm and with Cw from ZERO to 40%.
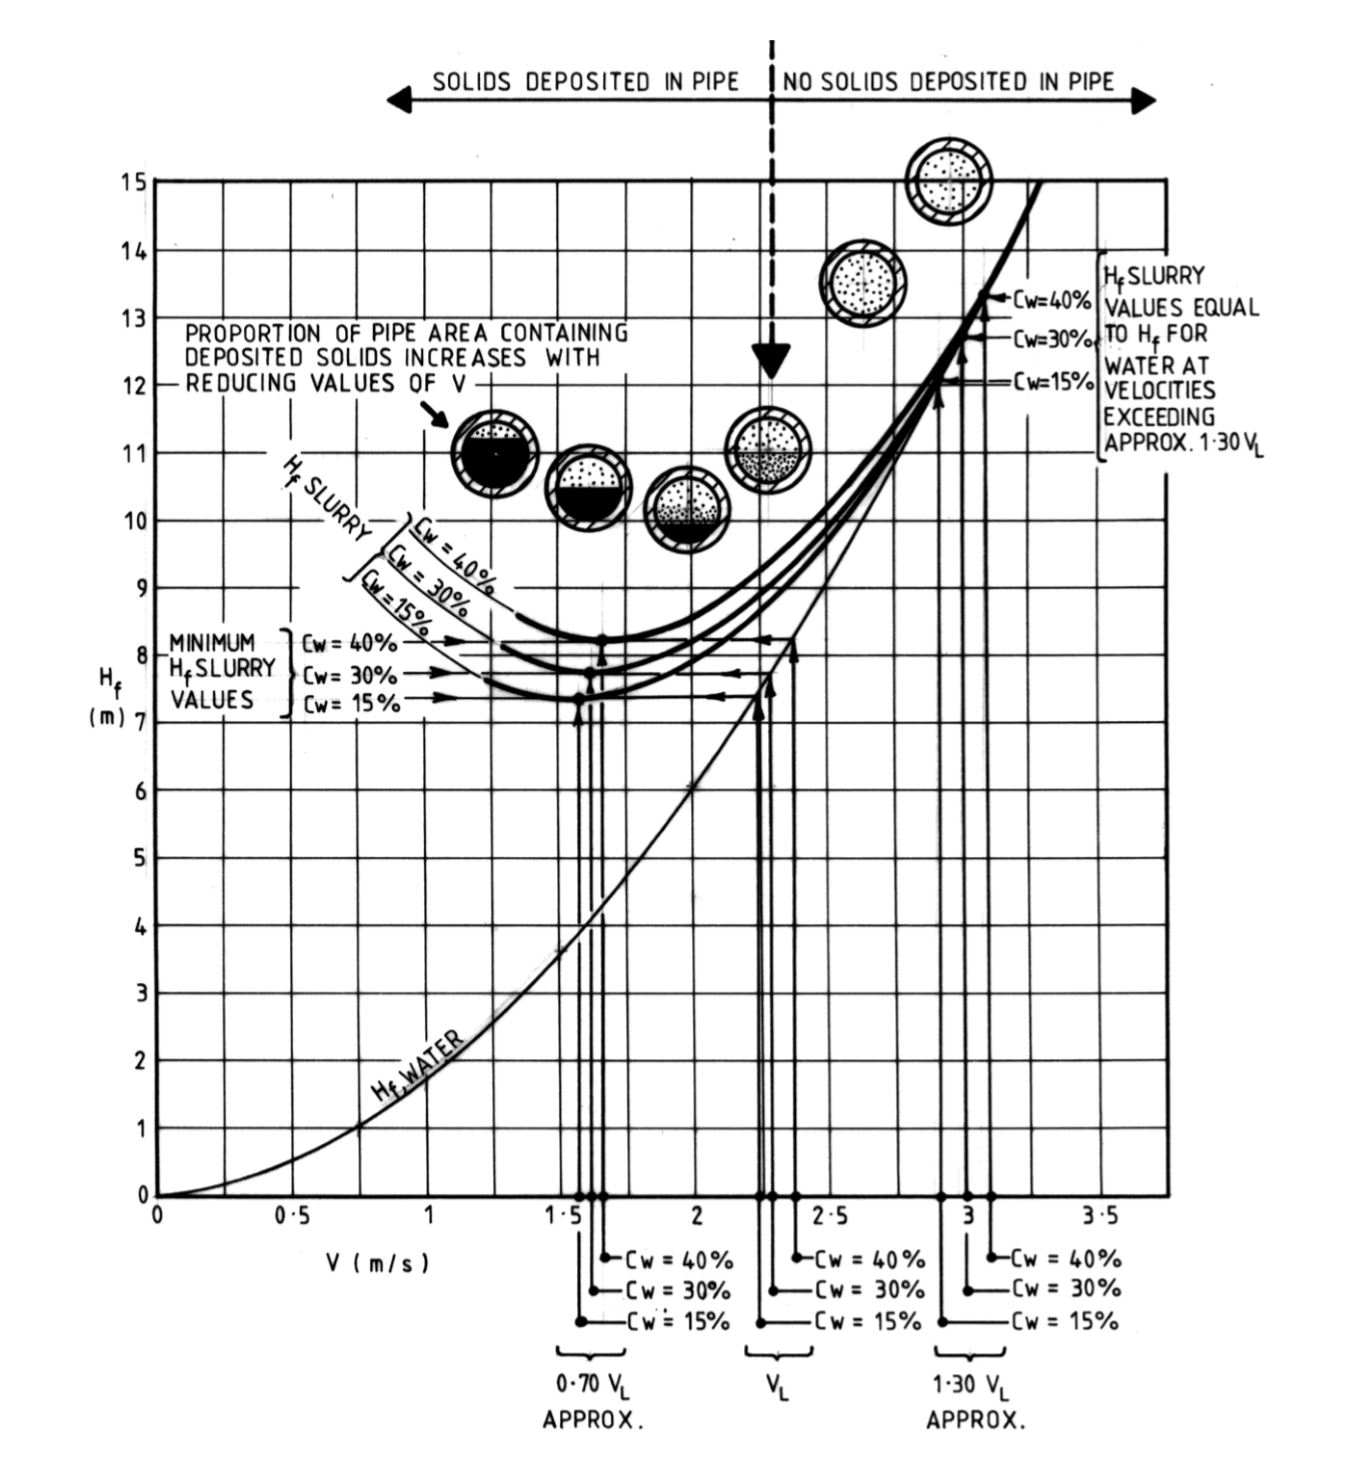
Typical friction head loss curves for this category are illustrated in Figure A3-1. Analyses of Hf data on these slurries indicates that, for any given solids concentration, the slurry Hf is numerically higher than the water Hf, for velocities below approximately 1.30 VL. However, the Hf value does not fall below a minimum at lower velocities, due to the effect of solids which settle in the pipe. This minimum occurs at approximately 0.70VL, where the slurry Hf is approximately numerically equal to the Hf for water at VL.

FIGURE A3-1 TYPICAL Hf CURVE FOR CATEGORY ‘A’ SLURRIES
The empirical data are summarised:
At 1.30 VL (approximately):
Slurry Hf is numerically equal to water Hf.
At 0.70 VL (approximately):
Slurry Hf is at its minimum value.
Slurry Hf is numerically equal to the Hf for water at VL.
The most economical slurry velocity is a velocity a little in excess of VL, thus these empirical relationships allow the construction of the useful portion of the estimated slurry Hf curve, in relation to the water Hf curve, for the same pipe.
Consequently, a reliable method of estimating Hf for water should be adopted, when estimating a Category ‘A’ Slurry Hf.
NOTE: Both water Hf (head of water) and slurry Hf (head of mixture) should each be expressed in head of actual “mixture” pumped.
Figure A3-1 also illustrates the construction of the estimation slurry Hf curves, based upon the estimated water Hf curve. Each slurry Hf curves meets tangentially with its minimum Hf value and meets tangentially with the water Hf curve where the value of VL corresponds to 1.30 VL.
It is emphasised that this empirical method of estimating Hf for these Category ‘A’ slurries is not precise but, in the absence of pipeline test rig data, or other more reliable data, it provides estimates considered to be reasonably accurate for many practical slurry pumping applications.
Category ‘B’: Particles essentially all coarser than 50µm and finer than 300µm but with Cw greater than 40%.
Generally, friction head losses for this category are much higher than for Category ‘A’ due largely to the increased friction effect of the more closely-packed solids content upon the pipewall. This effect generally increases with increasing Cw and is so greatly influenced by a number of variables, for example, Cw, S, Sl, d50, and actual sieve analysis of solids present that it is not possible to provide a simple empirical method of estimating slurry Hf.
In general, slurry Hf values may vary over a range, commencing with values approximately equal to those applicable to Category ‘A’ slurries at Cw = 40%, to values up to double or more those of Category ‘A’ slurries, for velocities in excess of VL.
Consequently, Hf values for Category ‘B’ slurries must often be estimated, then adjusted by an “experience factor”. The Hf values are first estimated as if for category ‘A’, after allowing for the lower values of FL (and VL) associated with values of Cw in excess of Cw = 30%, see Figure A3-1.
The true values of Hf may be double or more the estimated values. This is allowed for by providing reserves of speed and power for values of Hf up to double, or more, of the values estimated for Hf. While this introduces the risk of large error in the estimation of Hf, the effective overall error in estimating Total Dynamic Head (H) is relatively small, if the other components of H (for example, Z, Hpf and Hve), when combined, represent the major portion of H.
Should the value of H be estimated with a relatively small error, the effect would probably be almost insignificant. For example, it would simply result in a slightly higher or lower value of Zs in the hopper and/or a correspondingly slightly higher or lower power consumption. Should the error be more significant, with obvious overspeed or underspeed, the pump speed may be adjusted, for example, by changing the motor pulley or via a variable speed control, if provided. In either case, the drive motor should be adequately rated.
NOTE: Some test work results for slurry containing heavy solids (S = 4.6 to 5.3) of approximately 150µm sizing has shown a trend towards decreasing head loss with
increasing solids concentration, between Cv = 10% and Cv = 25% (that is, Cw between approximately 40% and 60%).
Many Warman pumps are used in heavy-duty Category ‘B’ slurry applications.
Typical examples includes the following:
a) Mill Discharge Plant;
b) Thickener Underflow;
c) Sand Tailings Stacking, and;
d) Gravity Concentrator Feed.
Category ‘C’: Particles essentially coarser than 300µm and Cw from ZERO to 20%.
Generally, friction head losses for Category ‘C’ slurries are also much higher than for Category ‘A’.
The more common applications for Warman pumps on Category ‘C’ slurries are the suction dredging of gravel and/or coarse sand. In normal dredging operations, Cw is often less than 20%, due to the impracticality of continuously entraining such coarse particles at the intake of the suction pipe at a higher value of Cw.
Hf for these slurries is estimated on the basis of the minimum average velocity FOR DESIGN being no less than VL when FL = 1.4.
For VL and for velocities greater than VL – the slurry Hf is taken to be numerically equal to 1.10 Hf for water, that is, numerically 10% higher than the estimated water Hf.
Category ‘D’: Particles essentially coarser than 300µm and Cw greater than 20%.
Generally, friction head losses for Category ‘D’ slurries are higher than for Category ‘A’. The values of Hf may be first estimated by the same method as for Category ‘A’. However, the true slurry Hf may vary from values close to those for Category ‘A’ up to three times or more those of Category ‘A’ slurries, (for velocities in excess of VL). Consequently, reserves of speed and power should be provided.
The recommended method for estimating Hf for clear water is by using Darcy’s formula as follows:

where,
Hf = Friction Loss (m)
L = Total Equivalent Length of Pipe (m)
D = Inside diameter of pipe (m)
F = Darcy Friction Factor
V = Velocity (m/s)
G = Gravitational Acceleration (9.81 m/s2)
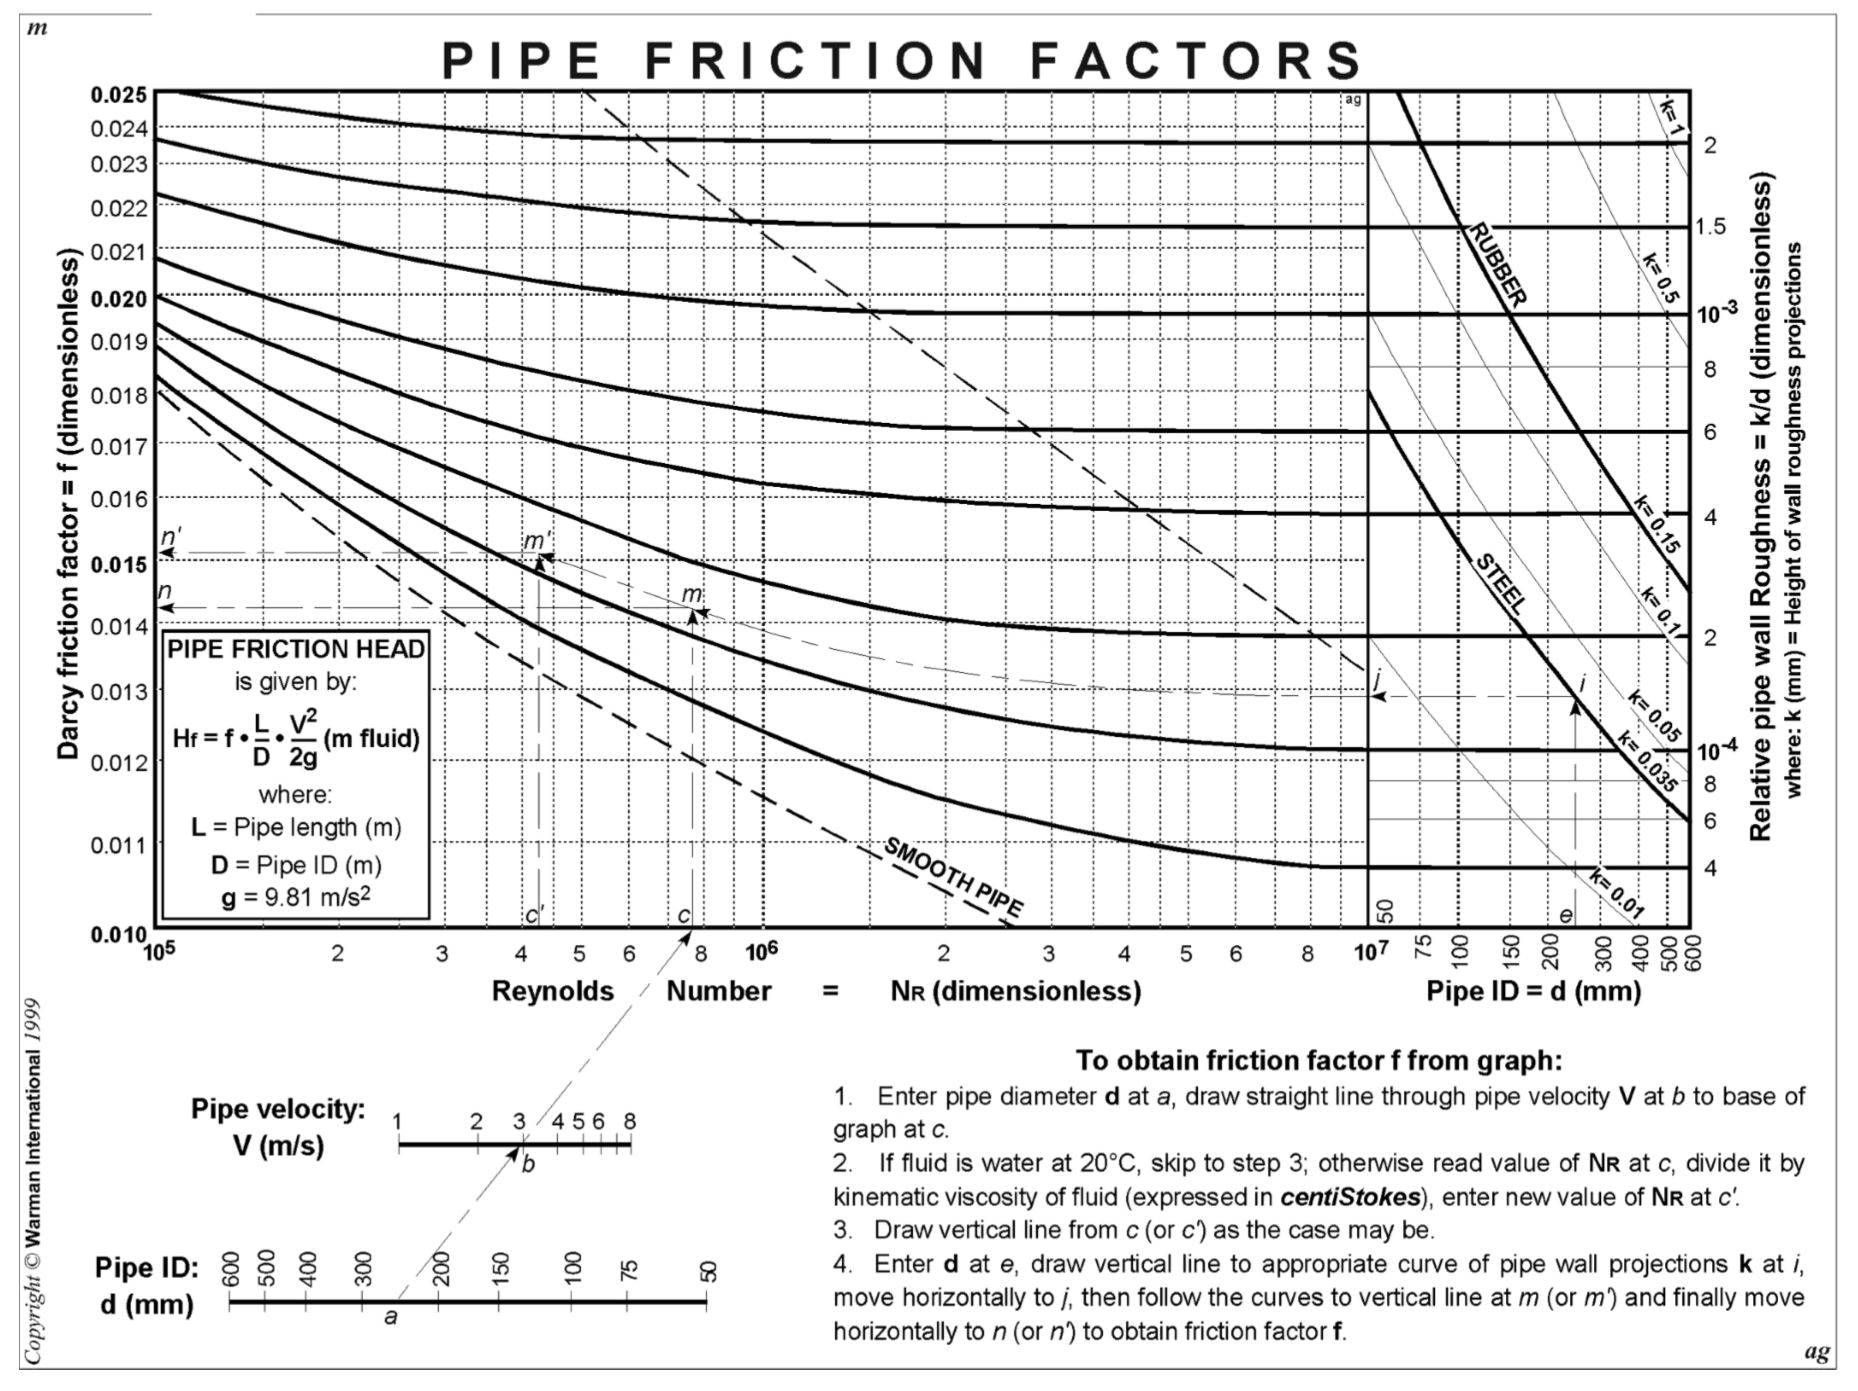
Use the Warman Pipe Friction Chart, Figure A3-2, to evaluate the Darcy Friction Factor, f.

FIGURE A3-2 WARMAN PIPE FRICTION CHART
NOTE: For convenience, this chart is entered at values of Inside Diameter of Pipe: “d”, expressed in mm.
- The application of Darcy’s formula, in combination with the Warman Pipe Friction Chart, is the recommended method of estimating Hf for water. This information should then be used for construction of the System Resistance Curves for clear water and Category ‘A’ slurries (by the empirical method) illustrated in Figure A3-1.
The advantages of this procedure are:
i. The Warman Pipe Friction chart provides the Darcy Friction Factor (and thus Hf) values for clear water based on the most reliable data available to the date of this publication. This data take into account the maintenance of certain values for Relative Pipe Wall Roughness, k/d, due to the continuous ‘polishing’ action of abrasive slurries flowing through the pipes.
For example, on Figure A3-2, the values of k/d for ‘commercial steel’ pipes are the same as the values for ‘cement’ and ‘polythene’ pipes. However, when these pipes are used for handling non-abrasive liquids only, such as clear water, the true values of k/d for steel pipes would be actually a little higher, yielding correspondingly higher values of Hf for water.
ii. The empirical method for the construction of the estimated System Resistance Curve for water, and the subsequent construction of the System Resistance Curve for slurry allows for the varying degrees of difference between Hf for water and Hf for slurries. This is particularly the case in the range of flow rate between VL to 1.30 VL, which is the usual range of most interest.
b) Example of Friction Head Loss Estimation for Water
Given
L = 700m of commercial steel pipe
d = 200mm (ie: D = 0.200m), see Figure A3-3
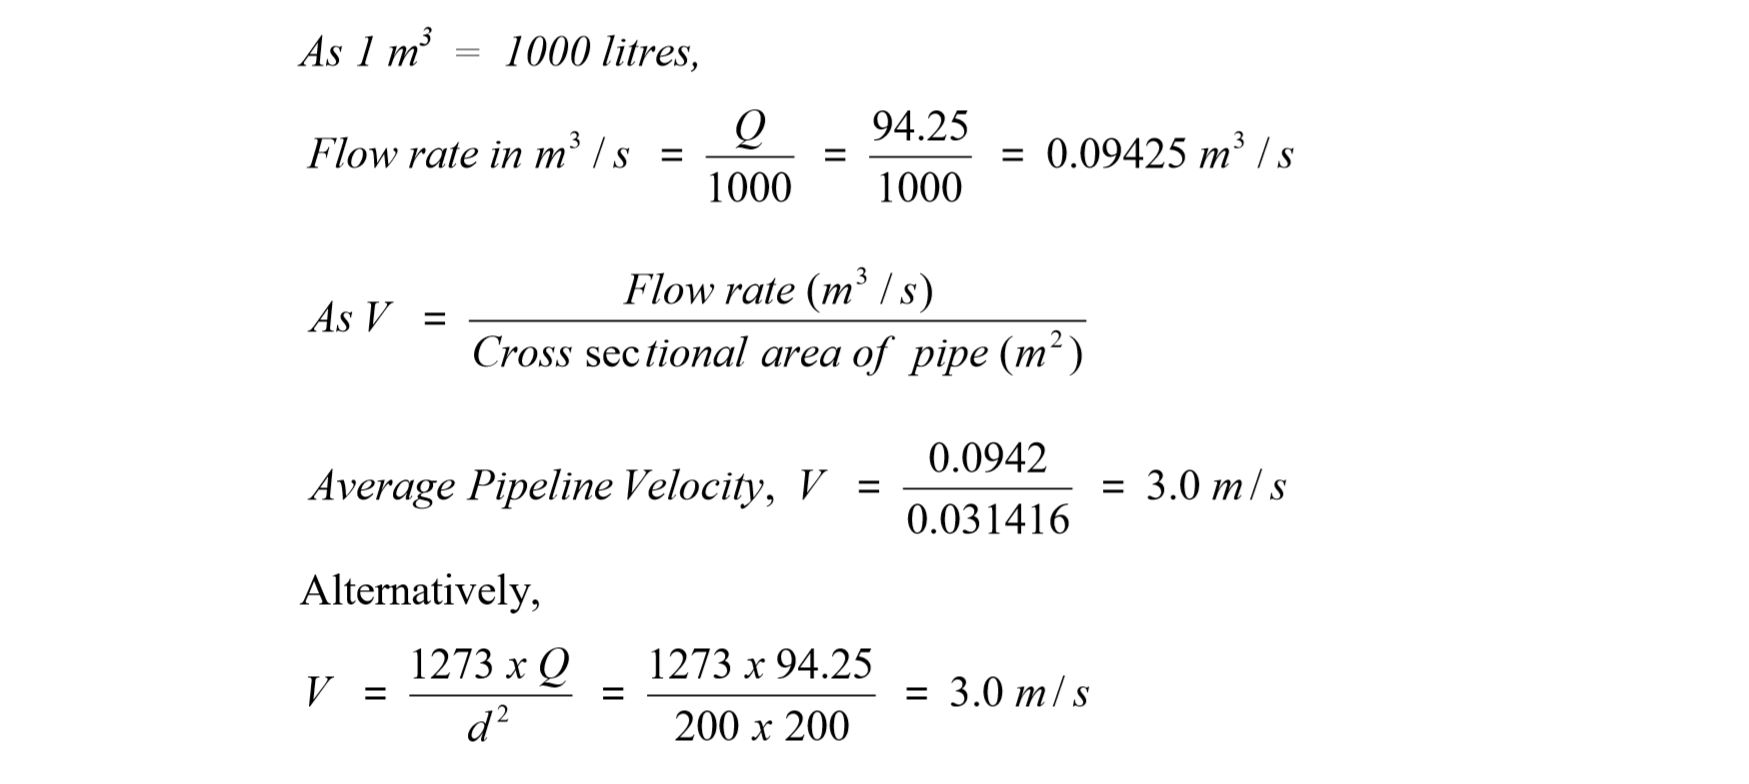
Q = 94.25 L/s
g = 9.81 m/s2

FIGURE A3-3 PIPE DIAMETER
- Calculations
Cross-sectional areas of Pipe at inside Diameter


Refer to the Warman Pipe Friction Chart, Figure A3-2.
As illustrated with arrowed lines, the chart is entered at the right hand bottom scale, along the applicable ‘d’ co-ordinate and, at its intersection with the appropriate (‘pipe surface material’) reference line, the corresponding ‘k/d’ co-ordinate is followed across, towards the left hand portion of the chart, until it intersects the ‘NR = 107’ co-ordinate.* From this intersection, the ‘k/d’ coordinate is drawn as a curve following the geometry of the adjacent family of curves. (* Reynolds Number (NR) is a dimensionless expression for the ratio of inertia forces to viscous forces).
The left hand portion of the chart is entered separately via a line drawn across the nomogram axes ‘d’ and ‘V’, at their applicable values, to intersect the ‘f = 0.008’ co-ordinate. This is equivalent to entering the chart at the appropriate value of Reynolds Number (NR) for clear water at 20°C. From this intersection, the ‘NR’ co-ordinate is followed until its point of intersection with the ‘k/d’ curve which has been drawn in the previous step.
This point lies on the required ‘f’ value co-ordinate: ‘f’ = 0.0158.
Thus the value of friction loss, Hf can be evaluated as follows:

 sales@mineco.vn

